Working with the RelPerm class and equinor/pyscal
This tutorial describes two workflows that allow us to pass relative permeability and capillary pressure data between the resqpy library and the equinor\pyscal library.
We will be moving water-oil relperm data between resqpy’s resqpy.olio.relperm.RelPerm class and pyscal’s pyscal.WaterOil class.
Please note that similar workflows can be used for moving gas-oil data to/from the pyscal.GasOil class.
Importing the relperm and wateroil modules
In this tutorial we will be moving water-oil relperm data between the RelPerm object’s resqpy.olio.relperm.RelPerm.dataframe() method and the WaterOil object’s pyscal.WaterOil.table attribute.
from resqpy.olio.relperm import RelPerm
from pyscal import WaterOil
# import a plotting library for visual inspection of the data
import matplotlib.pyplot as plt
# import resqpy model module to interact with a resqpy model
import resqpy.model as rm
resqpy RelPerm.dataframe() to pyscal WaterOil.table
Initialize an instance of a RelPerm object that is stored in a resqpy Model instance. This can be done using the uuid of the existing Grid2dRepresentation object that acts as support for the dataframe of relperm data.
model = rm.Model('/path/to/my_file.epc')
relperm_wo = RelPerm(model = model, uuid = uuid)
The dataframe of water-oil relperm data is then accessed using the resqpy.olio.relperm.RelPerm.dataframe() method.
relperm_wo_df = relperm_wo_obj.dataframe()
To initialize a pyscal WaterOil object, we first need to define a water saturation end-point that is compatible with the RelPerm dataframe being inputted. In this case, we can define swl, which will be the first water saturation in the generated WaterOil table, and set it equal to the minimum water saturation value in the RelPerm dataframe.
swl = relperm_wo_df.min()['Sw']
pyscal_wo = WaterOil(swl = swl)
The pyscal pyscal.WaterOil.add_fromtable() method generates a relperm table by interpolating relative permeability and capillary pressure data from the inputted dataframe.
pyscal_wo.add_fromtable(dframe = relperm_wo_df, swcolname = 'Sw', krwcolname='Krw', krowcolname='Kro', pccolname='Pc')
pyscal_wo_df = pyscal_wo.table
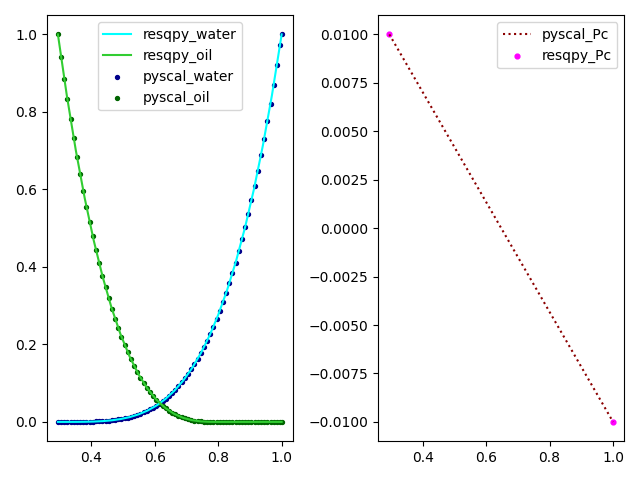
We’ll generate some plots to visually compare the inputted RelPerm data to the WaterOil data.
fig, (ax1, ax2) = plt.subplots(nrows = 1, ncols = 2)
ax1.plot(relperm_wo_df['Sw'], relperm_wo_df['Krw'], label = 'resqpy_water', c = 'cyan')
ax1.plot(relperm_wo_df['Sw'], relperm_wo_df['Kro'], label = 'resqpy_oil', c = 'limegreen')
ax1.scatter(pyscal_wo_df['SW'], pyscal_wo_df['KRW'], label = 'pyscal_water', c = 'darkblue', s = 8)
ax1.scatter(pyscal_wo_df['SW'], pyscal_df['KROW'], label = 'pyscal_oil', c = 'darkgreen', s = 8)
ax1.legend( )
ax2.scatter(relperm_wo_df['Sw'], relperm_wo_df['Pc'], label = 'resqpy_Pc', c = 'magenta', s = 12)
ax2.plot(pyscal_wo_df['SW'], pyscal_wo_df['PC'], label = 'pyscal_Pc', linestyle = 'dotted', c = 'darkred' )
ax2.legend( )
fig.tight_layout()
plt.show()
The image below compares two sets of relperm and capillary pressure data:
pyscal WaterOil.table to resqpy RelPerm.dataframe()
Moving data in the opposite direction is simple, and involves reformatting the column names of the WaterOil table to be compatible with the RelPerm initialiser method.
We reference the same WaterOil table instance, pyscal_wo_df, from the previous section.
model = rm.Model('/path/to/my_file.epc')
all_relevant_pyscal_cols = ['SW', 'SG', 'KRW', 'KRG', 'KROW', 'KROG']
cols = sorted(list(set(pyscal_wo_df.columns).intersection(set(all_relevant_pyscal_cols))), reverse=True)
if 'PC' in pyscal_wo_df.columns:
    cols.append('PC')
col_remap_dict = {k: (k.capitalize() if len(k) < 4 else k.capitalize()[0:3]) for k in cols}
pyscal_wo_df_processed = pyscal_wo_df[cols].rename(columns = col_remap_dict)
# intialize a new RelPerm object, write hdf5 and create xml for object
relperm_wo = RelPerm(model = model, df = pyscal_wo_df_processed)
relperm_wo.write_hdf5_and_create_xml()